
Amazon DSP for New to Brand Growth Backed by SellerApp 2026 Benchmark Data
Descriptions
Amazon DSP for New to Brand Growth is about more than driving another purchase. New to Brand, or NTB, measures purchases from customers who have not bought from your brand on Amazon within the previous 12 months, making it one of the clearest signals of whether your DSP campaigns are actually expanding your customer base. A campaign can deliver strong ROAS while doing little for acquisition if most of its conversions come from shoppers who already know your brand.
That is why NTB data deserves to be evaluated alongside sales and ROAS. It can show how effectively your campaigns are bringing in first time customers, which audiences are contributing to those purchases, and whether your targeting is reaching shoppers with genuine acquisition potential. SellerApp’s 2026 benchmark report puts the Amazon DSP new to brand purchase rate at 36.5%, showing that NTB purchases represent a meaningful share of DSP attributed sales. But the number alone is not the insight. This article breaks down what NTB data reveals about audience performance, attribution paths, campaign efficiency, and where your next growth opportunity may sit. You’ll also see benchmark data from SellerApp’s 2026 report to put your NTB performance into context, rather than evaluating it in isolation. If you’re struggling to tell whether your DSP budget is actually bringing in new customers, keep reading. We’ll show you how to read your NTB data, identify what is driving acquisition, and turn those insights into smarter targeting and budget decisions.
Quick Guide :
What New to Brand Means on Amazon
Before optimizing for new customers, advertisers need to understand what Amazon actually counts as new to brand and how that classification affects campaign reporting. NTB is not simply a label attached to any shopper who has never interacted with an ad. The metric is tied to purchase history and attribution, which makes the definition important when comparing campaigns. Understanding that foundation also makes the later optimization decisions much easier to interpret.
The 12 Month NTB Definition
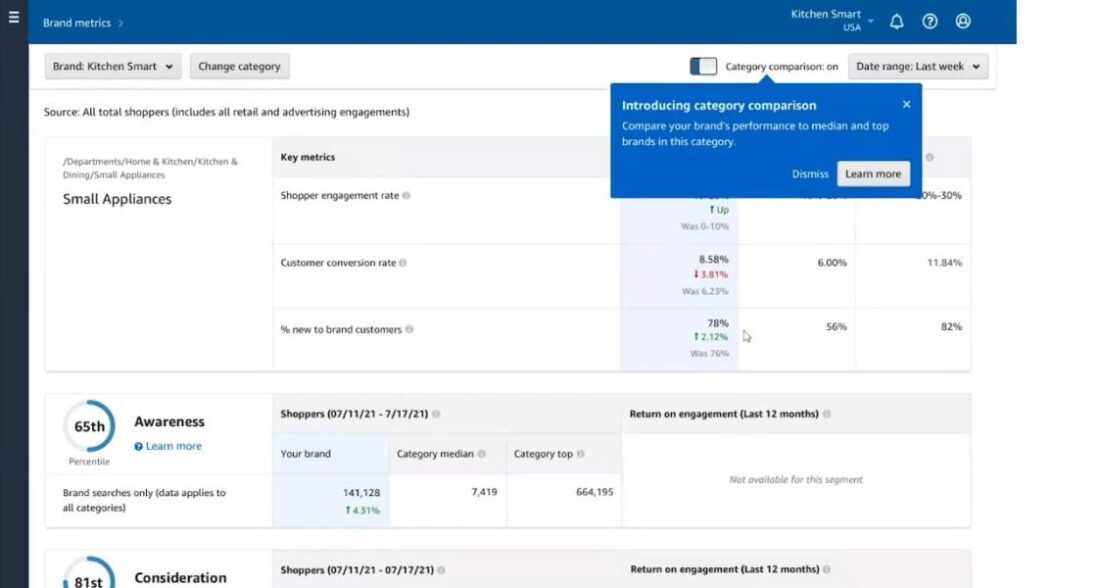
Amazon classifies a purchase as new to brand when the shopper has not purchased from the brand during the previous twelve months and then completes an eligible purchase. The lookback period matters because a recent customer does not become new to brand simply because they interact with a different campaign. Sponsored Ads and Amazon DSP can both drive NTB purchases, but they play different roles. Sponsored Ads often capture shoppers already showing purchase intent, while DSP can introduce the brand to relevant audiences earlier in the journey, creating more opportunities for new customer acquisition. A shopper can see or click an ad and purchase without qualifying as NTB. Amazon determines NTB status from the shopper’s purchase history, so existing customers can still generate attributed sales without contributing to customer acquisition. This is why advertisers should separate total purchases from NTB purchases when evaluating campaign performance. Consider a skincare brand that generates 100 DSP attributed purchases from a campaign. If only 25 come from shoppers who had not purchased the brand in the previous twelve months, the campaign is doing more to convert existing demand than expand the customer base. Another campaign could generate fewer total purchases but bring in 40 new customers. If acquisition is the goal, that campaign deserves a closer look even with lower overall ROAS.
How Amazon Tracks and Attributes NTB Purchases
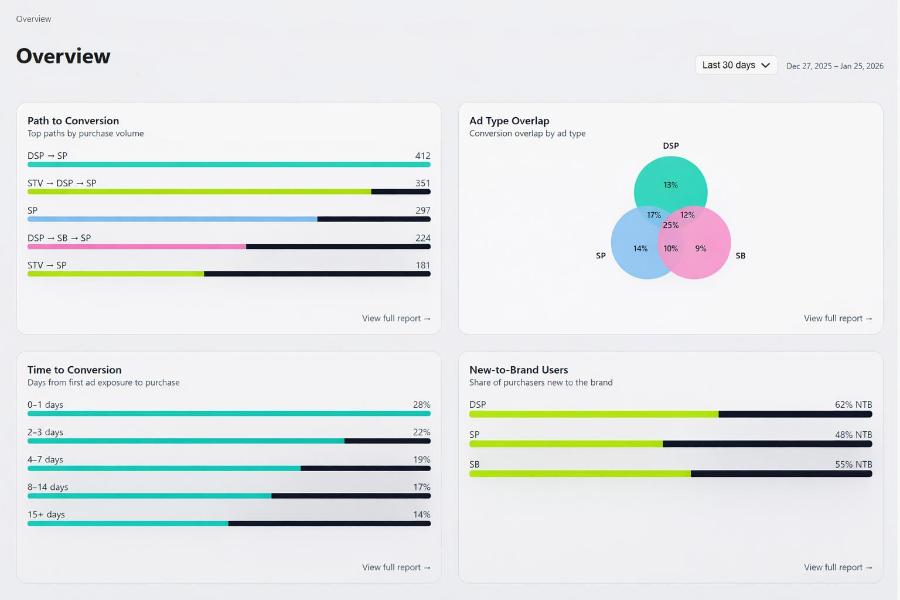
NTB reporting becomes useful when you understand what sits behind the number. Amazon distinguishes between click attributed and view attributed conversions, so DSP can contribute to a purchase even when the shopper does not click the ad before converting. SellerApp’s DSP dashboard brings these performance signals together with campaign and audience insights, making it easier to see which audiences are contributing to NTB purchases and where performance is changing. For deeper attribution analysis, Amazon Marketing Cloud (AMC) can connect aggregated advertising signals across campaigns and channels to reveal the paths that contribute to new customer purchases. Advertisers should also consider promoted product and brand halo outcomes. A campaign can influence demand beyond the exact product shown in the ad, so evaluating only the promoted product can leave part of the customer response out of the analysis.
For example, a brand may advertise its premium coffee machine through DSP while a shopper ultimately purchases a different coffee machine from the same brand. Looking only at the promoted product would miss that broader brand response.
The key is to understand which conversion types and attribution signals you’re looking at before deciding whether a campaign is actually creating new customer demand.
Why NTB Is a Strong DSP Growth Metric
NTB benchmarks show what strong customer acquisition can look like A campaign can look highly efficient while contributing relatively little to customer acquisition. A beauty brand, for example, may see strong ROAS from shoppers who already recognize the brand, while a prospecting campaign produces fewer total purchases but a much higher share of NTB purchases. If expanding the customer base is the objective, the second campaign may deserve more attention even if its overall ROAS looks weaker. SellerApp’s 2026 benchmark report puts the overall Amazon DSP NTB purchase rate at 36.5%, giving advertisers a useful reference point when evaluating how much of their DSP attributed sales are coming from new customers.
The benchmark also shows meaningful variation across categories
| Category | Amazon DSP NTB Purchase Rate | What It Suggests |
| Pets | 35% to 42% | Strong opportunity to acquire new customers despite repeat purchase behavior |
| Beauty | 35% to 42% | NTB can represent a significant share of DSP attributed purchases |
| Electronics | 28% to 34% | Lower NTB rates can reflect longer consideration cycles and established brand preferences |
| Overall DSP benchmark | 36.5% | More than one in three DSP attributed purchases came from NTB customers |
These benchmarks should be used as context, not a pass or fail threshold. A brand’s NTB rate can vary based on category economics, purchase frequency, brand maturity, audience availability, and campaign strategy. The more useful question is whether your NTB performance is moving in the right direction and which audiences and campaigns are contributing to that growth.
How Amazon DSP Drives and Measures New to Brand Growth
Reaching new shoppers is only the first part of an NTB strategy. Advertisers also need to understand what happens after those shoppers see or interact with a DSP ad. Different audiences can contribute to purchases through very different paths, and the final conversion may not always appear under DSP reporting. Connecting audience performance with attribution gives advertisers a clearer view of where DSP is actually contributing to customer acquisition.
DSP Assisted vs DSP Only vs DSP to Search Conversions
A DSP conversion can happen through different paths. A shopper may see or click a DSP ad and purchase directly. Another shopper may interact with DSP, later search for the brand, and then purchase through Sponsored Ads. Treating those paths as identical can hide useful information. If DSP to search journeys account for a meaningful share of NTB purchases, reducing DSP spend because Sponsored Ads received the final conversion credit could weaken the acquisition funnel. Consider a shopper who sees a DSP ad for a new skincare product but does not purchase immediately. A few days later, the shopper searches for the brand on Amazon and completes the purchase through a Sponsored Ads interaction. Looking only at the final conversion would make the search campaign appear responsible for the entire outcome, while the broader path shows that DSP introduced the brand earlier in the journey. Attribution analysis helps advertisers identify these patterns before reallocating budget away from audiences that are contributing to acquisition.The search campaign may be capturing demand that DSP helped create.Picture a shopper who sees a DSP ad for a new protein brand on Monday, searches the brand name on Wednesday, and purchases after clicking a Sponsored Product on Thursday. A last click view may credit the search interaction while hiding the role of the earlier DSP exposure. For an advertiser trying to grow the brand, that path is more informative than simply declaring the search campaign the sole driver of the sale.
Using AMC to Understand the NTB Customer Journey
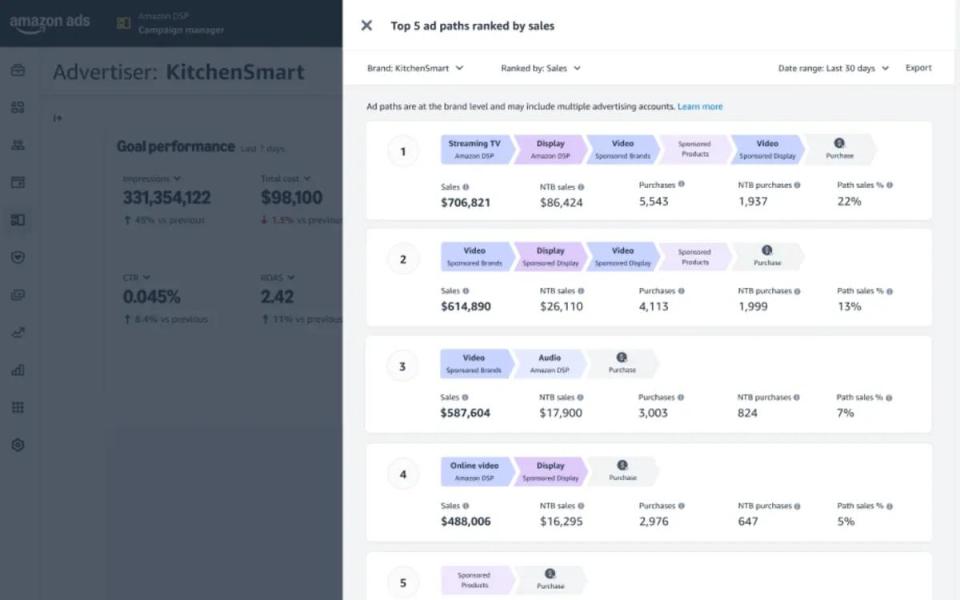
Standard reporting tells you what converted. Amazon Marketing Cloud can help you understand how the shopper moved through the funnel.For NTB analysis, that can mean examining which DSP audiences were exposed before a purchase, whether those shoppers later interacted with Sponsored Ads, how many exposures preceded conversion, and where audience overlap exists.
For example, if a prospecting audience repeatedly appears in NTB journeys that later convert through branded search, cutting that audience because it has weak direct ROAS would be a poor optimization decision.The attribution path provides additional evidence that the audience is contributing to acquisition.An electronics brand could find that shoppers exposed to a DSP campaign often return through branded search several days later before purchasing. That pattern would support keeping the prospecting campaign active while testing its audience and creative mix, rather than judging it only by immediate click attributed sales.
How to Optimize Amazon DSP Campaigns for NTB Growth
Once attribution data shows which audiences contribute to NTB purchases, use it to guide budget decisions rather than optimizing for ROAS alone. Compare NTB purchase rate, NTB CPA, frequency, and spend at the audience level to see where acquisition is actually coming from.
Build a custom NTB report
Pull campaign and audience data with spend, reach, frequency, NTB purchases, total purchases, and ROAS. Calculate NTB purchase rate and NTB CPA using your report data, then compare each audience against SellerApp’s 36.5% DSP NTB benchmark. Use the results to identify audiences worth scaling, testing, or reducing. An audience with a strong NTB rate and efficient CPA may deserve more budget even if its ROAS is lower, while rising frequency with stagnant NTB purchases can signal diminishing returns.This turns NTB reporting into a practical optimization loop: find the audiences bringing in new customers, measure acquisition efficiency, and shift spend toward the strongest opportunities.
Use Attribution Insights to Reallocate Budget
Use attribution data to understand not just which audiences generate NTB purchases, but where they appear in the path to purchase. Then use those patterns to guide budget changes.
Step 1 Compare audience contribution
Look at NTB purchases, NTB rate, and spend across audiences. Identify audiences generating similar acquisition volumes but through different paths.
Step 2 Check where each audience appears
An audience that relies on repeated exposures and mostly direct conversions may need a frequency review. An audience that consistently appears earlier in successful DSP to search purchase paths may be contributing to demand creation.
Step 3 Identify the budget opportunity
Reduce spend where additional impressions are reaching the same shoppers without increasing NTB purchases. Consider increasing spend on audiences that consistently contribute to successful NTB journeys.
Step 4 Add category context
Compare performance with SellerApp’s benchmark report before making a final decision. Pets and Beauty show a 35% to 42% NTB rate, while Electronics sits at 28% to 34%. A lower rate is not automatically a problem when purchase behavior and acquisition economics differ by category.
Step 5 Reallocate and measure
Shift budget gradually, then monitor NTB rate, NTB CPA, frequency, and attribution paths to see whether the change actually improves new customer acquisition.
Do Not Confuse Attribution With Incrementality
| What you measure | What it tells you | What it does not tell you |
| NTB attribution | Where DSP participated in a new customer’s purchase journey | Whether the ad actually caused the purchase |
| Audience exposure | Which audiences saw or interacted with your campaigns | Whether those shoppers would have purchased anyway |
| Holdout testing | Whether exposed shoppers generate more demand than a comparable control group | The full journey behind every conversion |
| AMC analysis | More detail on audiences, journeys, and interactions across campaigns and channels | Definitive causality without an appropriate test design |
| Incrementality testing | How much additional demand advertising actually created | Which individual touchpoint deserves all the credit |
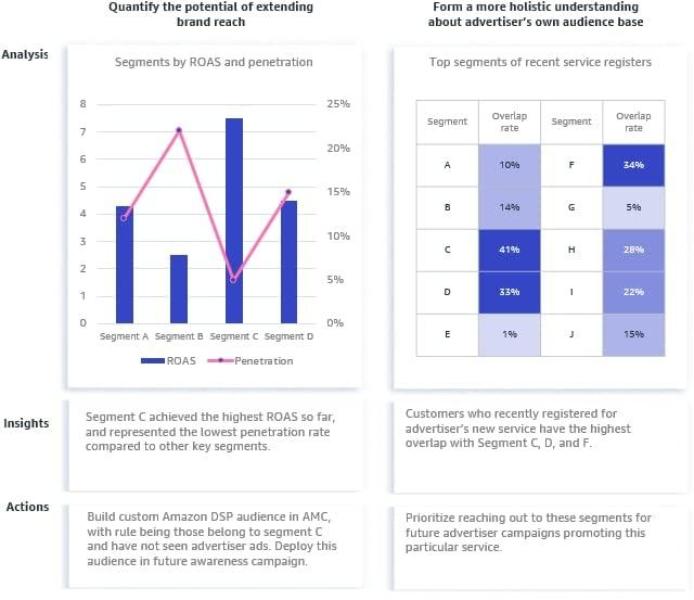
The takeaway is to see attribution to understand where DSP contributed and incrementality to determine how much additional demand it created.
Amazon DSP New to Brand Benchmarks for 2026
SellerApp’s 2026 benchmark report gives advertisers a useful reference point for evaluating DSP acquisition performance. The report shows a 36.5 percent NTB purchase rate through Amazon DSP. More than one in three DSP attributed purchases therefore came from customers who had not previously bought from the brand. Category differences are significant. Pets and Beauty recorded NTB rates between 35 and 42 percent, while Electronics recorded rates between 28 and 34 percent. The broader cost environment also matters. SellerApp’s benchmark report shows Amazon’s average DSP CPM at $7.82 for 2025, up 47.46 percent from the previous year. Pets had the highest category CPM at $11.66, while Toys and Games had the lowest at $4.30. If a higher CPM category produces stronger NTB potential or higher customer lifetime value, paying more to reach the right shoppers can make economic sense. For example, a pet brand may face a higher CPM than a toy brand but still accept that cost because its customers purchase replenishable products throughout the year. Comparing the two categories on CPM alone would make the pet campaign look expensive. Comparing acquisition cost with NTB rate and expected repeat purchase behavior gives a more useful picture. SellerApp’s category spotlight illustrates this with Pets. The category combines a premium $11.66 CPM with a 35 to 42 percent NTB rate and strong repeat purchase behavior. That makes the initial acquisition cost easier to justify when the brand can retain those customers.
Structuring a Full Funnel Campaign for New to Brand Growth
Build the funnel around three campaign layers, with each layer serving a different NTB role.
Step 1 Use prospecting to create new demand
Target relevant in market, lifestyle, contextual, or lookalike audiences that have not yet purchased from the brand. Optimize this layer for reach, NTB rate, and new customer acquisition, rather than expecting retargeting level ROAS.
Step 2 Use consideration campaigns to develop interest
Retarget shoppers who viewed relevant products or engaged with the brand but have not purchased. Monitor NTB purchases closely to ensure this layer is still acquiring new customers rather than repeatedly reaching existing buyers.
Step 3 Let Sponsored Ads capture high intent
Use Sponsored Products and Sponsored Brands to capture shoppers who move from DSP exposure into category or brand searches. Evaluate DSP and Sponsored Ads together when DSP exposure precedes search and purchase.
Step 4 Separate the audiences and budgets
Keep prospecting, consideration, and retargeting audiences distinct enough to measure their NTB contribution. This makes it easier to identify audience overlap, frequency buildup, and where budget is actually driving incremental acquisition.
Step 5 Reallocate based on NTB contribution
Compare each layer on NTB rate, NTB CPA, frequency, and attributed paths. Increase investment where audiences consistently contribute new customers and reduce spend where exposure is becoming repetitive without improving acquisition.
Key Takeaway Is Your DSP Program Actually Driving New Customers
NTB is most useful when it moves beyond a reporting metric and becomes part of the optimization decision. SellerApp’s benchmark data shows a 36.5 percent NTB purchase rate for Amazon DSP, giving advertisers a useful reference point for evaluating how much of their DSP activity is reaching new customers. The real opportunity is to understand what sits behind that number. Which audiences are bringing in new customers? Which conversion paths are contributing to those purchases? Where is spend generating incremental reach rather than repeatedly reaching the same shoppers? Answering those questions turns NTB reporting into a growth strategy. SellerApp helps advertisers bring those answers together through DSP performance data, audience insights, AMC analysis, and benchmark context. Instead of stopping at what converted, teams can identify where acquisition is working and make more informed decisions about where the next dollar of DSP spend should go. See how SellerApp can help you turn Amazon DSP data into actionable growth insights.
FAQ
1. Why am I getting sales but none of them are new to brand customers?
A campaign can generate plenty of sales without generating many NTB purchases if it is reaching shoppers who have already purchased from your brand within Amazon’s NTB lookback period. Check NTB purchase rate alongside total purchases to see whether your campaign is acquiring new customers or mainly converting existing demand. If ROAS is strong but NTB remains low, review your audience mix and targeting strategy.
2. How accurate is New to Brand ROAS?
NTB ROAS is useful for measuring the revenue efficiency of customer acquisition, but it should not be treated as proof that advertising caused every attributed purchase. Attribution shows that an eligible purchase followed an advertising interaction. It does not prove incrementality. For larger campaigns, combine NTB reporting with attribution path analysis and, where possible, incrementality testing to understand the actual impact of DSP.
3. If I exclude previous customers, why aren’t 100 percent of my sales new to brand?
Excluding previous customers from a targeting audience does not guarantee that every resulting purchase will qualify as NTB. Amazon determines NTB eligibility using its purchase history and attribution rules, while audience exclusions operate at the targeting level. A shopper can therefore be eligible to receive an ad but still not qualify as NTB based on their purchase history.
4. How do I track new to brand orders specifically, not just conversions?
Separate NTB purchases from total conversions in your Amazon advertising reporting, then evaluate NTB purchase rate, NTB sales, NTB ROAS, and cost per NTB purchase. Comparing these metrics across audiences and campaigns shows whether your spend is acquiring new customers or primarily converting shoppers who already know the brand. AMC can provide additional visibility into the journeys that lead to those purchases.
5. Can retargeting campaigns generate new to brand customers?
Yes. A shopper who has interacted with your brand but has not purchased within Amazon’s NTB lookback period can still qualify as NTB when they eventually purchase. The important distinction is between engaged shoppers who have never purchased and existing customers who are returning to buy again. Reviewing NTB performance by audience helps determine whether retargeting is still contributing to customer acquisition or mainly driving repeat purchases.
The post Amazon DSP for New to Brand Growth Backed by SellerApp 2026 Benchmark Data appeared first on SellerApp Blog.
from SellerApp Blog https://ift.tt/syedF2D
via IFTTT
Add a review